
Any discussion surrounding maps won’t be complete without mentioning ‘map projections’. Map projections are how we take the (mostly) spherical Earth and represent it on a flat sheet of paper or computer screen. Different projections maintain and distort different aspects of the Earth, so the projection chosen for a map affects the story it tells.
The most basic map projections are based on the concept of having a light source either within or outside of the Earth, and a piece of paper onto which the continents are “projected”. The three variations of these basic projections are:
- Cylindrical – where the paper is rolled into a cylinder and touches the Earth along one or two lines
- Conical – where the paper is shaped like a cone and touches the Earth along one or two lines
- Azimuthal – where a flat piece of paper which touches the Earth at one point or along a line.
- Here we discuss a selection of map projections, some of which were developed hundreds of years ago yet are still used today and give an overview of why
understanding projections are important in map study.
1. MERCATOR PROJECTION:
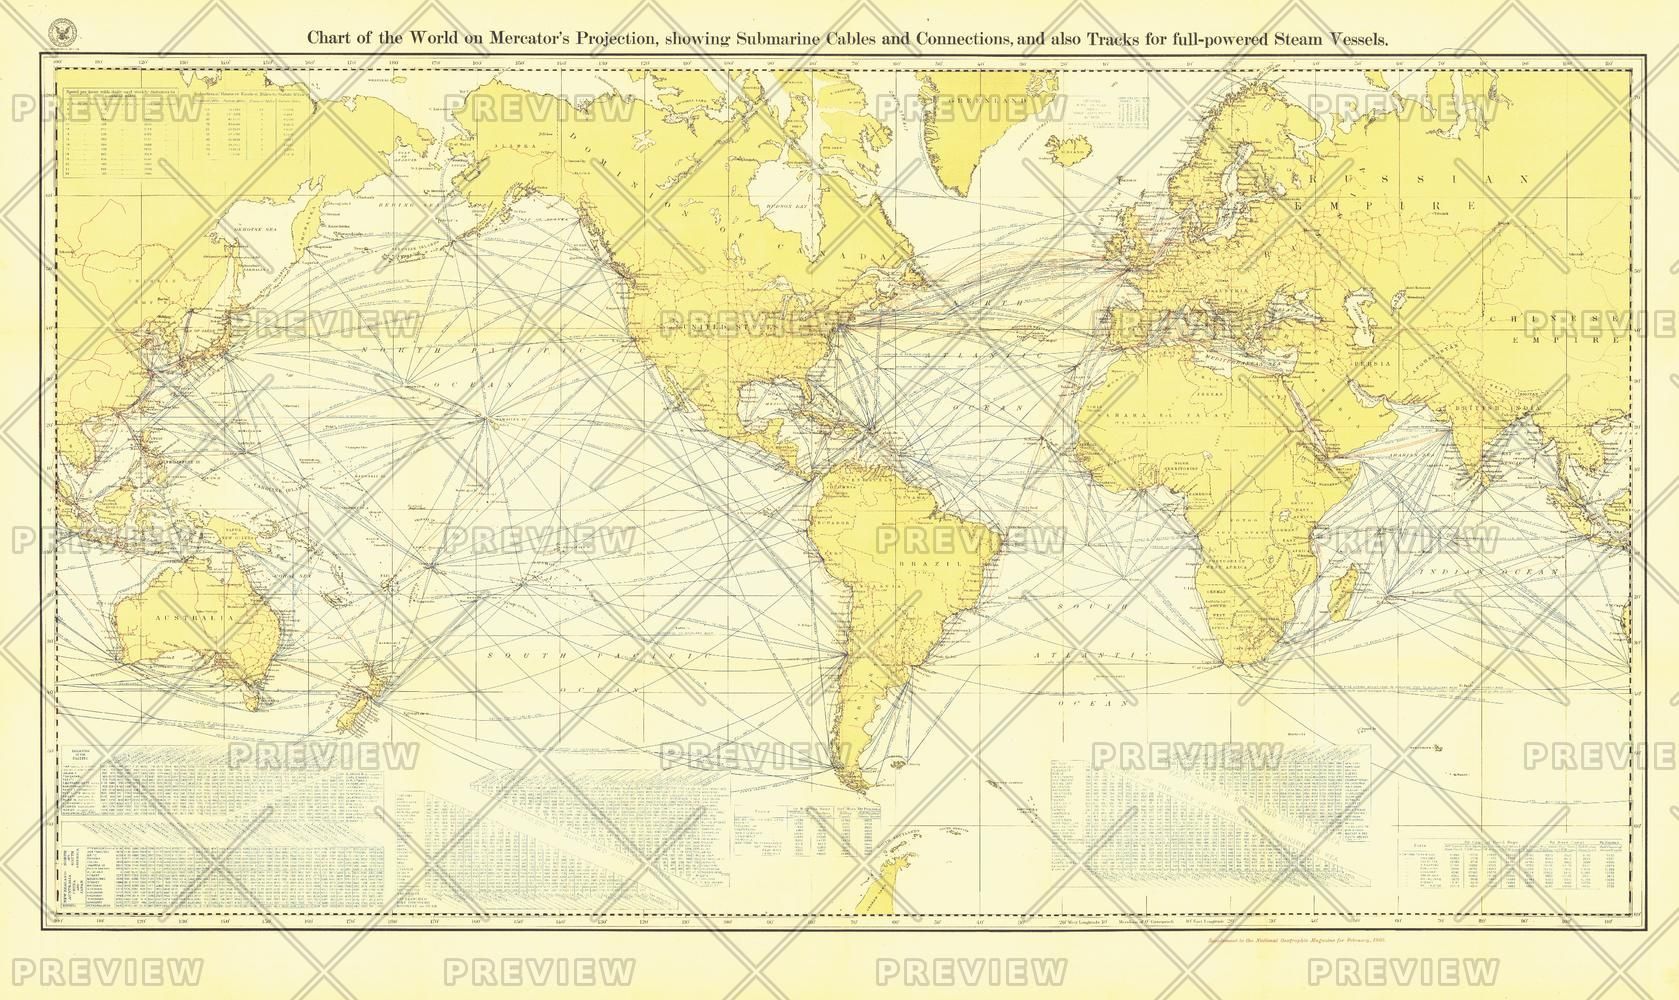
The above image from MapTrove shows the chart of the world as depicted by Mercator. The Mercator projection is considered as an eminent discovery on the forefront of world map projections. Developed by Flemish geographer Gerardus Mercator in 1569, this map projection became the standard for nautical purposes.
Since the Mercator projection represents lines of constant course (rhumb lines) as straight segments that preserve the angles with the meridians (lines of longitude), it offers convenient results to hand-plot courses with parallel rules and triangles on this map. The development of the Mercator projection represented a major breakthrough in the nautical cartography of the 16th century. However, it was much ahead of its time, since the old navigation and surveying techniques were not compatible with its use in navigation.
The Mercator projection is an example of a cylindrical projection. The most basic Mercator projection has the piece of paper rolled around the Earth along the Equator with the open ends at the poles. The size of the land masses along the Equator is accurate, but as you move north and south, features are stretched. Greenland is really much smaller than Africa! You might recognize this projection since a variant is commonly used in Web map applications.
2. LAMBERT CONFORMAL CONIC PROJECTION:
The Lambert conformal conic (LCC) is one of the several map projection systems developed by Johann Heinrich Lambert – an 18th-century Swiss mathematician, physicist, philosopher, and astronomer. This projection is best to be employed for middle latitudes and is often used for aeronautical charts, aviators, and maps with wide east-west extents. Pilots use aeronautical charts based on LCC because a straight line drawn on a map approximates a great-circle route between endpoints for typical flight distances.
Conceptually, the projection seats a cone over the sphere of the Earth and projects the surface onto the cone. The cone is unrolled, and the parallel (line of latitude) that was touching the sphere is assigned unit scale. That parallel is called the reference parallel or standard parallel. “Conformal” indicates the angle between features on the Earth is preserved in the map image.
Lambert Conformal Conic is often used in small-scale maps of Canada.
3. AZIMUTHAL EQUIDISTANT PROJECTION
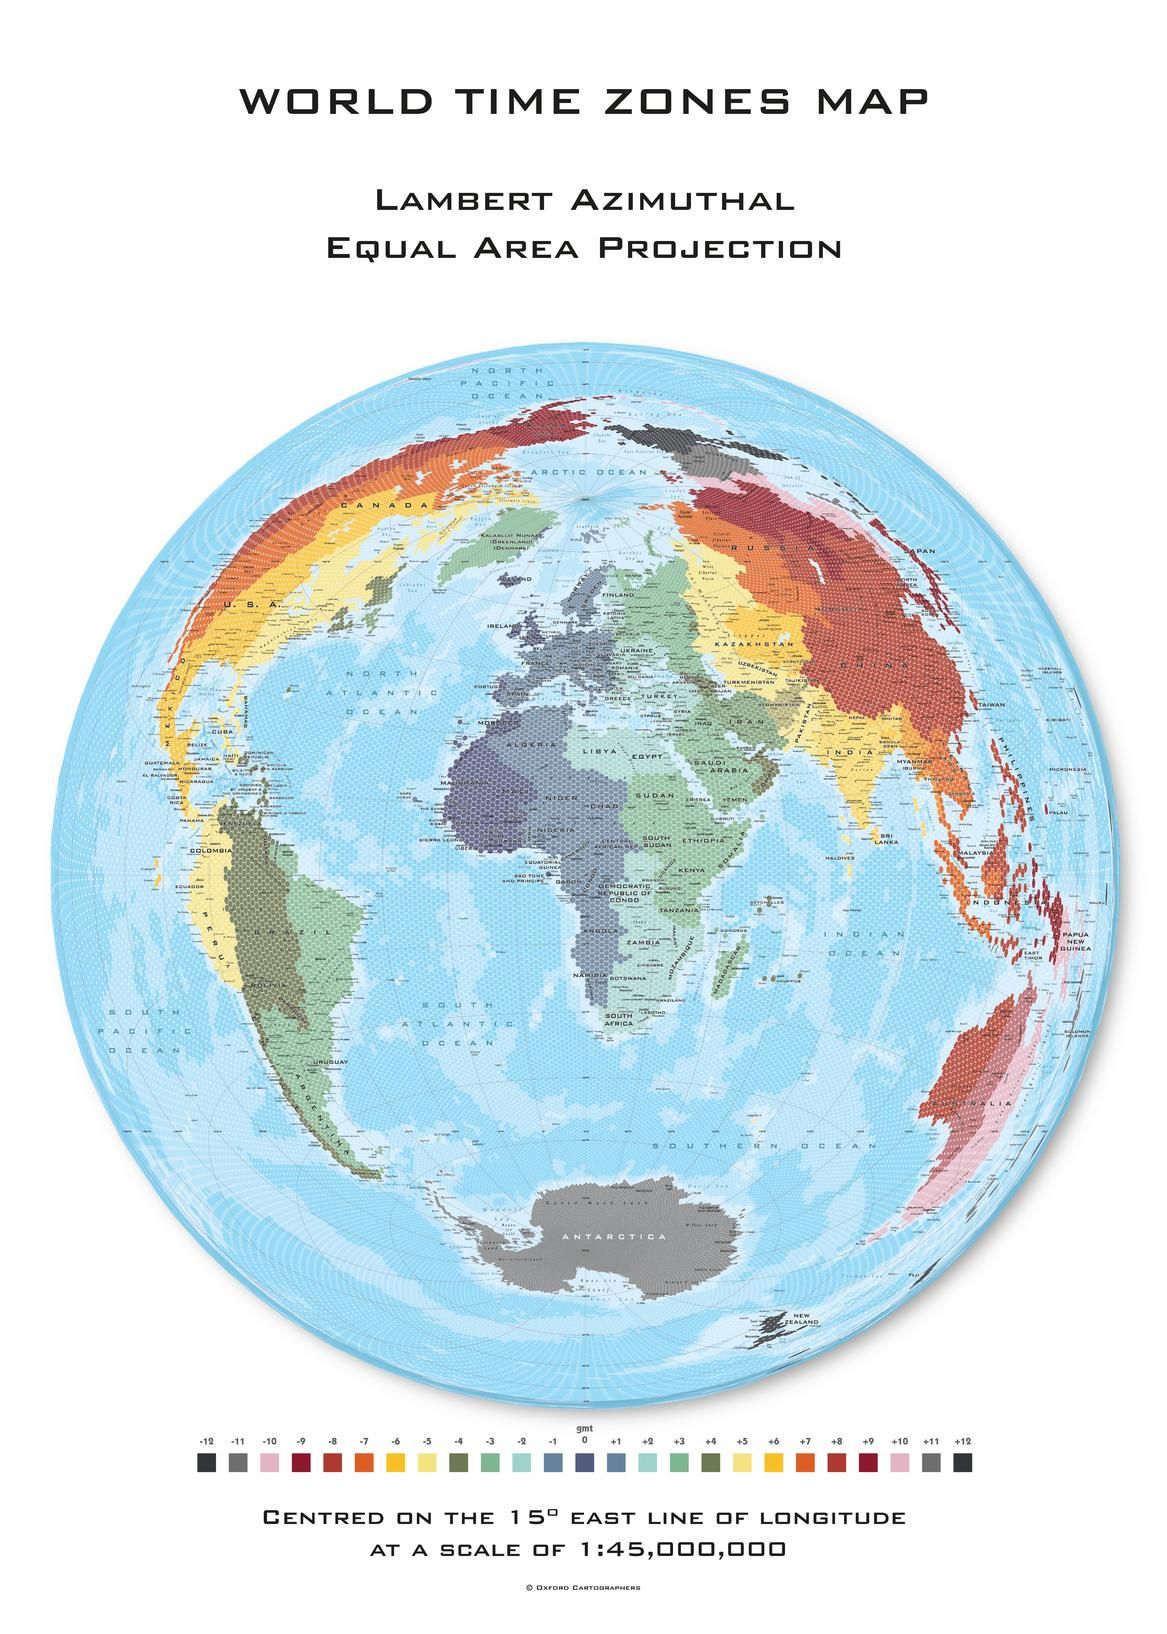
The United Nations emblem includes a polar azimuthal equidistant map centered on the North Pole. As an azimuthal projection, the sheet of paper is flat, and in the case of the emblem above, touches the Earth at one location at the North Pole.
All points on the map have correct proportional distances and azimuths (directions) from the center point. The shape and area of the continents grow more distorted as you move away from the center point of the map.
4. TRANSVERSE MERCATOR PROJECTION:
This map projection is an adaptation of the standard Mercator projection. “Transverse” refers to the fact at the cylinder of paper is rotated 90° from the standard Mercator projection – it is rolled around a meridian, and crosses the poles.
Many modern national mapping systems employ a transverse Mercator projection to deliver high accuracy in zones a few degrees of east-west extent. A common transverse Mercator projection you may have encountered is Universal Transverse Mercator, or UTM, where the Earth is split into 6° segments, numbered from 1 through 60 starting at the International Date Line heading eastward around the globe. Another example of a transverse Mercator projection is the British National Grid used by the Ordnance Survey.
5. ROBINSON PROJECTION:
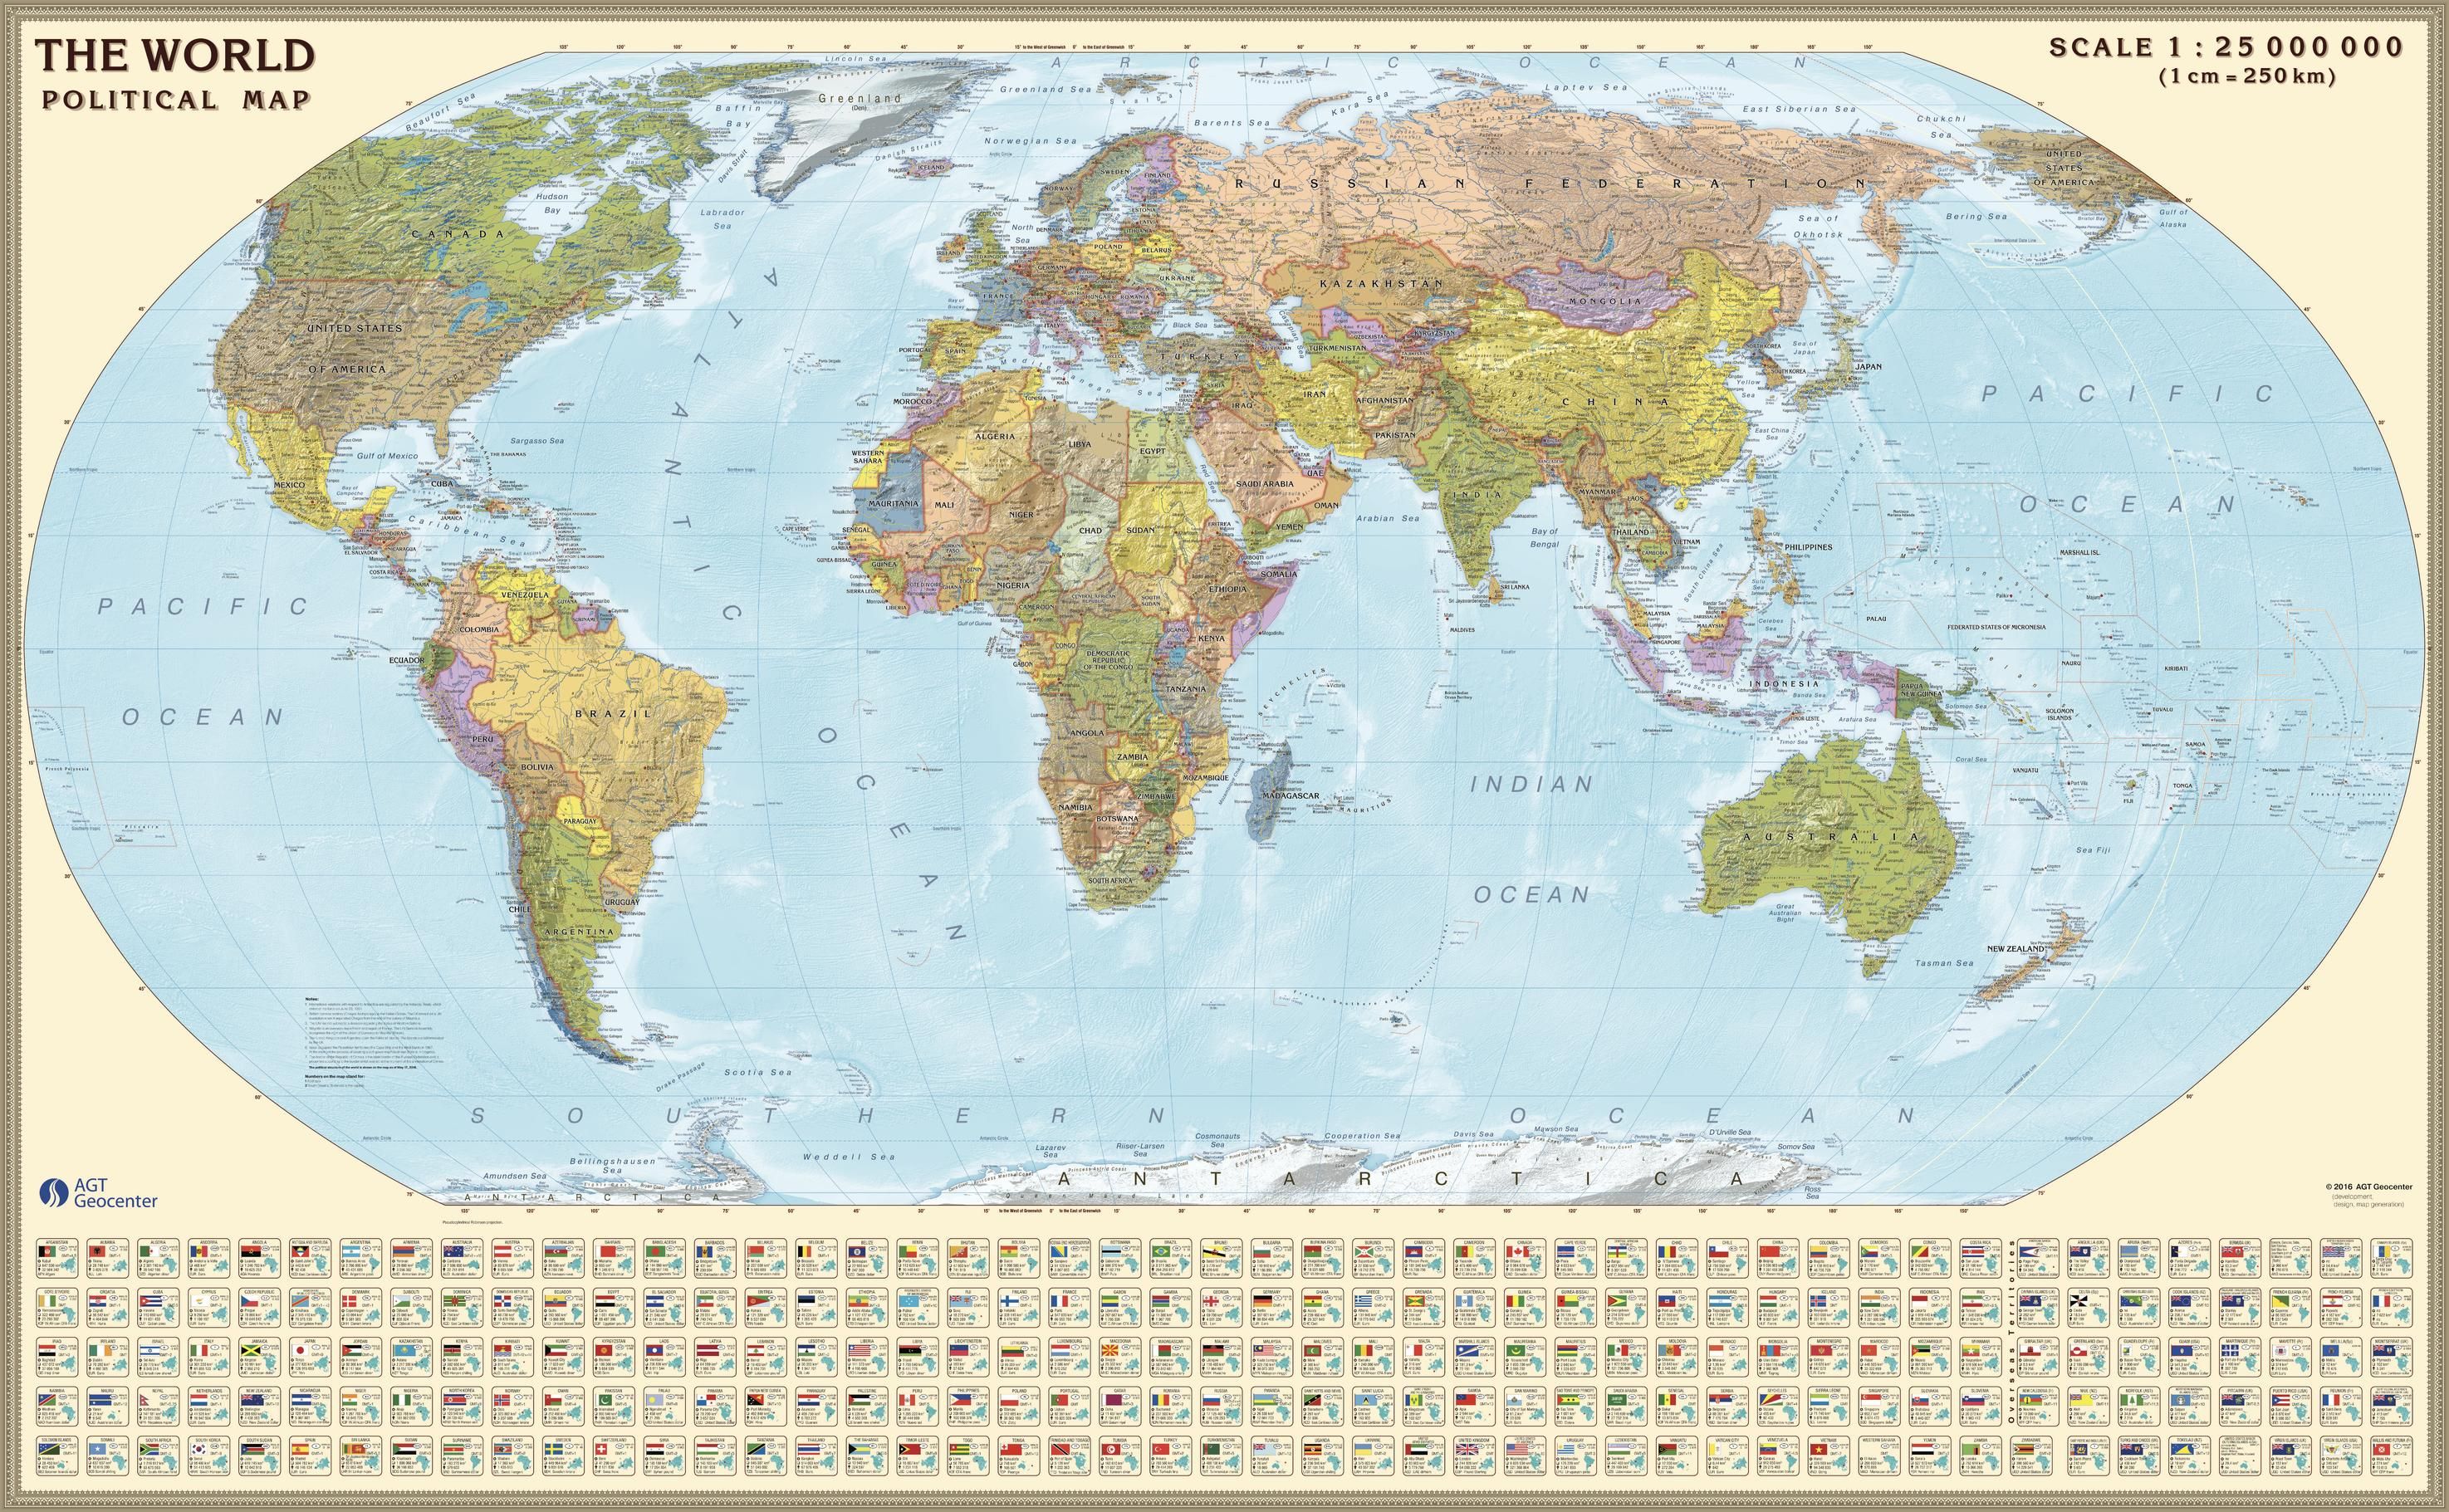
This political map of the World exhibits Robinson projection featuring capitals, main cities, roads, and railroads. Country profiles are included to provide information including the national flag, capital, area, population, time zone, national currency and international dialing code.
The Robinson Projection was developed by Arthur H. Robinson in 1961 and was an attempt to make world maps “look right” rather than measure precisely. This map projection shows the entire world at once. It was specifically created in an attempt to find a good compromise to the problem of readily showing the whole globe as a flat image.
In this projection, the Earth is shown within an ellipse with a flat top and bottom. The Robinson Projection is a pseudocylindrical projection – lines of latitude are parallel to the equator, but lines of longitude are elliptical arcs.
Furthermore, this projection by Robinson is distinctive as its primary purpose is to create visually appealing maps of the entire world. It is a compromise projection as it does not eliminate any type of distortion.
6. GALL PETERS PROJECTION:
This projection is named after James Gall and Arno Peters. Gall is credited with describing the projection in 1855 at a science convention and Peters for bringing this projection to a wider audience in the early 1970s by means of the “Peters World Map”.
This rectangular Gall-Peters map projection is an exemplar of cylindrical equal-area projection as it depicts all areas such that they have correct sizes relative to each other, but distorts shapes.
The name “Gall-Peters projection” is said to have been used first by Arthur H. Robinson in a pamphlet put out by the American Cartographic Association in 1986. Gall-Peters projection also achieved notoriety in the late 20th century as the centerpiece of a controversy about the political implications of map design.
7. SPACE OBLIQUE MERCATOR:
As a Mercator variant, space-oblique Mercator projection (SOM) is a cylindrical projection. “Oblique” refers to the fact that the cylinder touches the Earth along on neither a meridian like a transverse Mercator projection nor parallel like a standard Mercator projection. Rather, its touching point is somewhere in between.
TheSOM was advanced by John P. Snyder, Alden Partridge Colvocoresses, and John L. Junkins fairly recently, in 1976. Snyder had an interest in maps, originating back to his childhood and he regularly attended cartography conferences while on vacation.
When the United States Geological Survey (USGS) needed to develop a system for reducing the amount of distortion caused when satellite pictures of the ellipsoidal Earth were printed on a flat page, they appealed for help at one such conference. Snyder worked on the problem armed with his newly purchased pocket calculator and devised the mathematical formulas needed to solve the problem.
The space-oblique Mercator projection provides a continual conformal mapping of the swath sensed by a satellite. Moreover, SOM is the only projection presented that takes the rotation of Earth into account and is often referred to as, “one of the most complex projections ever devised” by John W. Hessler – cartographic historian of Library of Congress.
8. WINKEL-TRIPEL PROJECTION:
This world map projection was proposed by German cartographer Oswald Winkel in 1921 and goes quite contrasting to the one presented by Robinson. This representation resorts to mathematics to curtail three major types of distortion – area, direction, and distance.
The National Geographic Society has drawn all its standard maps using the Winkel-Tripel projection since 1998. Many US schools follow suit. The only major drawback is that since this map does not preserve angles, it is nowhere close to replacing Mercator for navigation purposes.
9. AUTHAGRAPH:
The Authagraph world map is a modern innovative map that frames world’s physical components. Invented by Japanese architect Hajime Narukawa, this world map projection saw the light of the day in 1999. This world map was conceptualized by equally dividing a spherical surface into 96 triangles which were then projected onto a tetrahedron and unfolded onto a flat map Doing so not only helped in maintaining the proportions of land and water but also assisted in folding the map into a perfect, flat rectangle.
Authagraph realistically represents all oceans and continents, including neglected Antarctica. And while the general shape of the continents is maintained, their orientation is skewed upwards.